ACTIVITIES
ACTIVITIES
Goals and Metrics
The project is proceeding in six phases, with Phases 1 – 3 occurring in Year One and Phases 4, 5, and 6 occurring in Year Two.
PHASE 1: PATHWAYS ANALYSIS
› Analyze existing data for pathway trends
› Identify focus group targets
ANALYSIS OF HIGH SCHOOL INSTITUTIONAL MARKERS
- Identification of a set of relevant variables for the pathways analysis stage of the project
- Identification of relevant programs and majors at each of the 20 coalition campuses for the pathways analysis stage of the project
- Construction of data request templates for each of the 20 coalition campuses
- Alignment of math course numbers and titles at the 20 coalition campuses to a unified set of course names, using existing articulation agreements registered with the State of South Carolina Articulation Board
- Construction of a preliminary codebook for the pathways analysis data
- Cleaning of the pathways data
From the data requests, the pathways analysis team received data for 21,657 unique first-year students in relevant programs at the 20 coalition campuses. Analysis of major selection and initial college math course placement by county of origin allowed us to identify locations for Phase 2 focus group data collection. Deeper analysis is underway.
CHARTS
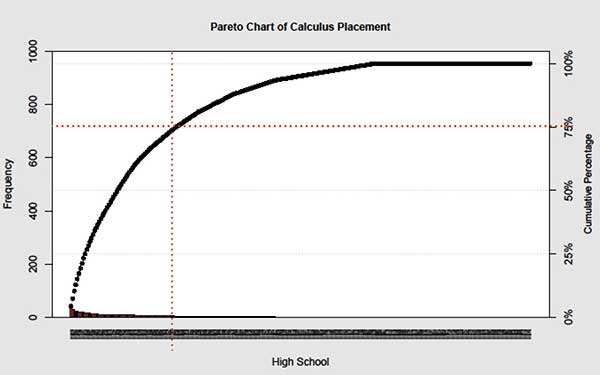
HIGH SCHOOL
› 23% of the high schools in South Carolina produce approximately 75% of the students in engineering-related fields placing in or above Calculus I at the four-year schools; since enrollment varies considerably among the high schools, this is not entirely surprising.
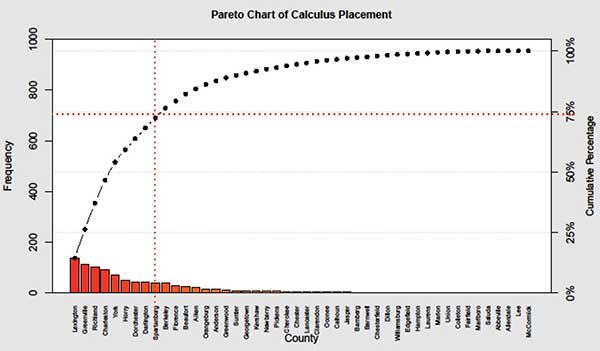
ENGINEER-RELATED
› Nine of the counties (20%) in South Carolina produce approximately 75% of the students in engineering-related fields placing in or above Calculus I at the four-year schools. This is also not entirely surprising, as we would expect more populous counties to produce more students in calculus.
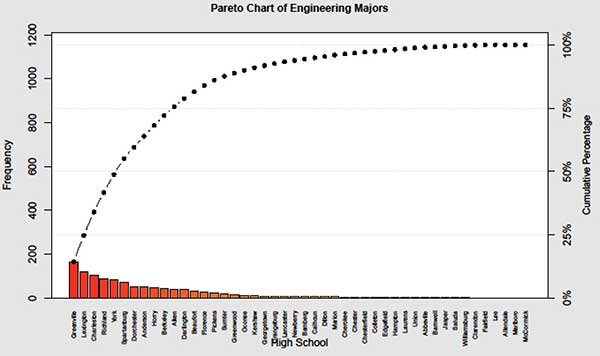
ENGINEER MAJORS
› Ten of the counties (22%) in South Carolina produce approximately 75% of all engineering majors in South Carolina. Again, population density accounts for some of this clustering, but there is not an exact match between these counties and the ones producing 75% of the calculus-ready students. Exploring these discrepancies may provide valuable insight into factors affecting both initial college math course placement and choice of engineering as a major.
MAPS
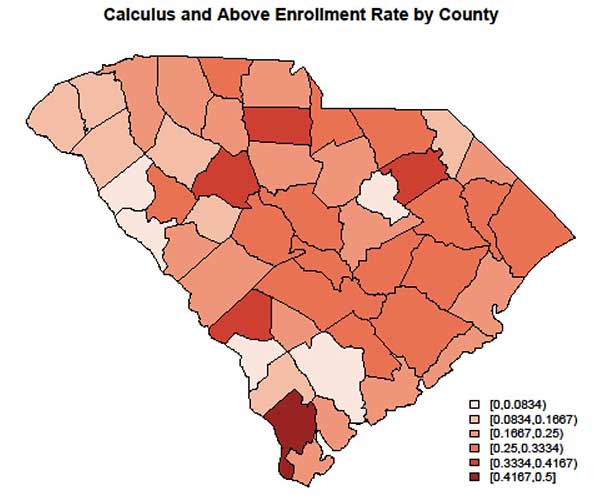
CALCULUS PLACEMENT
› The rate of calculus placement varies considerably by county, which may provide rich ground for exploration of district-level decision- making that fosters or hinder placement in calculus upon entering college.
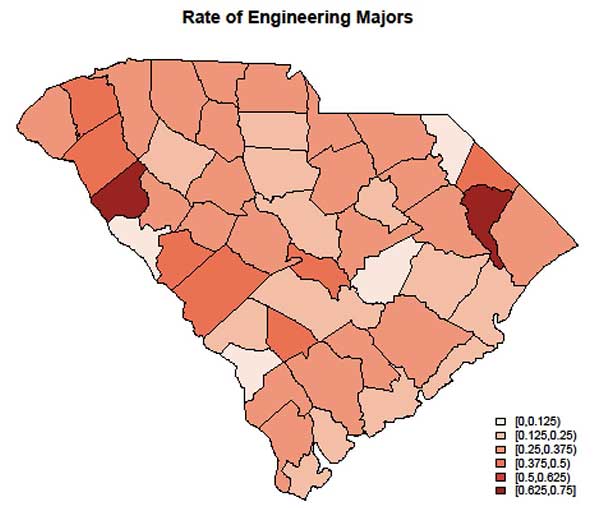
DECLARING MAJOR
› The rate of declaring an engineering major also varies considerably by county, and it is interesting to note that the counties in which 62.5-75% of students in an engineering-related field are actually in engineering (as opposed to business, a science field, or a technical field such as computer science) do not correspond to the counties with highest rate of placement in calculus. This discrepancy will be explored in our focus groups, with particular attention to the questions: Is there pressure on students in some areas to be engineers, even if they are not prepared going into college? Are some students perfectly qualified with good preparation, but simply choosing not to study engineering?
PHASE 2: FOCUS GROUPS
› Conduct focus groups
› Analyze focus group data
FOCUS GROUP TEAM
The Focus Group team worked with Advisory Board member and evaluator, Catherine Brawner, to develop the focus group protocol with different prompt groups for different target participants. The team also developed a qualification survey to be distributed through the Site Coordinators to identify potential focus group participants. They are currently in the process of collecting qualification survey data to identify focus group participants and schedule data collection. Concurrently, they are introducing the undergraduate researchers to principles of qualitative research and data analysis.
An NSF Project

INCLUDES: 1744497
WRAPPED: EEC-1737686
Ikhalfani Solan
SCSU
Stephen Mason
Denmark Tech
Eliza Gallagher
Clemson
Kris Frady
Clemson
Brian Habing
USC
A. Pfirman
GRA
M. Marcanikova
GRA
S. Roberson
UPIC
L.A. Dunwoody
UPIC
J. Brisbane
UPIC
EMERGING THEMES
EMERGING THEMES
Guidance Counselors
My senior year of high school, my guidance counselor was very helpful. He helped me get more scholarships than I previously had, upon admission. He was also the same person who encouraged me to apply here.
-Robin
PHASE 3: SURVEY DEVELOPMENT
› Use focus group data to create survey
› Identify focus group targets
