Next: PMLs
Contents
In this Section, a number of examples are provided to validate EMAP4. The examples illustrate different aspects of the EMAP4 code. The first set of examples employs ideal waveguides to compare the EMAP4 code to analytically derived solutions. The second set of examples uses transmission line geometries to compare the EMAP4 code to another code employing a different electromagnetic technique. The EMAP4 results are compared to results obtained using FASTCAP, a Methods of Moments (MOM) code. The third example is a cavity driven by a wide trace. This set of examples is used to compare EMAP4 results to measured data. These examples illustrate the wide variety of applications for the EMAP4 code. Another capability of the EMAP4 code is the use of Perfectly Matched Layers (PML) to create an absorbing boundary. Examples using PMLs are described in Section 7.
The examples in this section are based on
simple rectangular waveguides. The results of EMAP4 are
compared with analytical results. The first example is the
rectangular waveguide illustrated in Figure 8. The waveguide
has a cross-section of 8 cm by 4 cm. The length is 48 cm. The
frequency of excitation is 1910 MHz. The waveguide is excited
at one end in the TE10 mode and is shorted at the
other end. The waveguide is filled with a lossless dielectric
(e = 2.0).
Figure 8: Waveguide driven in the TE10
mode.
The analytic results are obtained using transmission line theory, assuming a TE10 excitation. For a transmission line, the voltage along the line is given by
. (11)
Here g is calculated as

This equation is used to derive the theoretical (analytical) waveform in Figure 9. As seen from the figure there is very good agreement between the EMAP4 results and the theoretically derived ones.
For the second example, the waveguide of the first example is now filled with a lossy dielectric. The properties of this dielectric are the relative permittivity e =3.0 and its conductivity s =0.02. The analytic results are obtained in the same manner as above. Here g is in the form a + jb. The results are plotted in Figure 10. The EMAP4 waveform matches the theoretical waveform very well. The lossy case performs better than the lossless case because the lossless case is more sensitive to small changes in the numbers involved.
Figure 9: Waveguide filled with a lossless
dielectric.
Figure 10: The waveguide filled with a lossy
dielectric.
The input file for the first example is given below:
# Waveguide driven in TE10 mode
celldim 1 cm
box 0 0 0 8 4 48
dielectric 0 0 0 8 4 48 2.0 0.0
esource 7 0 0 8 4 0 1910 y 0.1951 0
esource 6 0 0 7 4 0 1910 y 0.5556 0
esource 5 0 0 6 4 0 1910 y 0.8315 0
esource 4 0 0 5 4 0 1910 y 0.9808 0
esource 3 0 0 4 4 0 1910 y 0.9808 0
esource 2 0 0 3 4 0 1910 y 0.8315 0
esource 1 0 0 2 4 0 1910 y 0.5556 0
esource 0 0 0 1 4 0 1910 y 0.1951 0
esource 8 0 0 8 4 0 1910 y 0.0000 0
esource 7 0 0 7 4 0 1910 y 0.3830 0
esource 6 0 0 6 4 0 1910 y 0.7070 0
esource 5 0 0 5 4 0 1910 y 0.9240 0
esource 4 0 0 4 4 0 1910 y 1.0000 0
esource 3 0 0 3 4 0 1910 y 0.9240 0
esource 2 0 0 2 4 0 1910 y 0.7070 0
esource 1 0 0 1 4 0 1910 y 0.3830 0
esource 0 0 0 0 4 0 1910 y 0.0000 0
efield_output 0 2 0 8 2 48 example.out
The first line of the input file is a comment line. The celldim
statement sets the size of the mesh to be 1 cm in all cells in
all directions. This is about 15 cells per wavelength. The box
statement sets the four side walls and the back wall to be
conductors. It also sets the front wall to be conducting but
the tangential electric fields on the front wall are
overwritten by the esource statements. The dielectric statement
specifies the position and properties of the dielectric (this
has to be modified a little bit for the second example to
include the conductivity). The "efield_output" statement makes
EMAP4 write out the required electric fields to the file
example.out.
The esource statements are required to generate a TE10 mode. The first set of esource statements is 2-D, which initializes the diagonal and the non-diagonal edges in the face. Since we are initializing a TE10 mode, the values of the electric field at the diagonal edges are a little different from those at the non-diagonal edges (the shape is a sinsuoid). The second set of esource statements initializes the non-diagonal edges. The values of the electric fields go from zero at the ends to 1 in the middle in this example. For example, the value of the electric along the edges x=2 is set to 0.707 and 0.9240 at x=3. The diagonal edge in between is given a value 0.8315.
Inside the code, the value of the electric field along a
diagonal edge is initialized to times the value specified in the input file.
The diagonal edges are at an angle of 45 degrees to the
non-diagonal edges, so the electric field along these
edges is greater. In non-uniform meshes, the diagonal
edges need not be at an angle of 45 degrees. In that case,
the diagonal edges should be initialized differently.
In this section, simple rectangular coaxial transmission
lines are studied. The transmission line used here has a solid
center conductor and an outer conductor that is parallel to the
inner conductor surface. The transmission line is shown in
Figure 11.
Figure 11: Transmission line geometry.
This transmission line is excited using voltage (electric field) sources at one end and is terminated by resistors at the other end. FASTCAP is used to (numerically) calculate the capacitance per unit length of this simple transmission line. The characteristic impedance of the transmission line is calculated as,

where v = 3´ 108 m/s.
This is then compared with the characteristic impedance obtained using EMAP4. The characteristic impedance is determined by varying the value of the terminating resistors until the electric field along the transmission line is constant. The various configurations analyzed are outlined in Table III. A sample waveform showing the field as a function of position along the transmission line is also given in Figure 12. For this example, the following dimensions are used. The inner conductor width is 1 cm and the outer conductor width is 3 cm.
Table III. Transmission Line
Configurations.
| Inner conductor side | Outer conductor side | FASTCAP char. Imp. (ohms) | EMAP4 char. Imp. (ohms) |
| 1 cm | 3 cm | 48 | 50 |
| 2 cm | 4 cm | 31 | 33 |
| 3 cm | 5 cm | 23 | 25 |
The analytical waveform is calculated using the characteristic impedance from FASTCAP. The formula used here is,

The correlation in this example is fair. The discrepancies may be due to a number of factors. The termination may not accurately reflect the characteristic impedance, due to the location and number of the resistors. The modeling of the resistors may not be very accurate. The waveform is also sensitive to small changes in the values of the resistors, values of permeabiblity and permittivity used. The input file used for this example is as follows:
celldim 1 cm
box 0 0 0 3 3 24
aperture 0 0 0 3 3 0
aperture 0 0 24 3 3 24
conductor 1 1 0 2 2 24
esource 1 0 0 1 1 0 1000 y -1.0 0.0
esource 2 0 0 2 1 0 1000 y -1.0 0.0
esource 2 1 0 3 1 0 1000 x 1.0 0.0
esource 2 2 0 3 2 0 1000 x 1.0 0.0
esource 1 2 0 1 3 0 1000 y 1.0 0.0
esource 2 2 0 2 3 0 1000 y 1.0 0.0
esource 0 1 0 1 1 0 1000 x -1.0 0.0
esource 0 2 0 1 2 0 1000 x -1.0 0.0
resistor 1 0 24 1 1 24 600
resistor 2 0 24 2 1 24 600
resistor 2 1 24 3 1 24 600
resistor 2 2 24 3 2 24 600
resistor 1 2 24 1 3 24 600
resistor 2 2 24 2 3 24 600
resistor 0 1 24 1 1 24 600
resistor 0 2 24 1 2 24 600
efield_output 2 1 0 2 1 24 tline.out
The celldim statement defines every cell to be 1 cm in all directions. The box statement eshtablishes the six faces of the outer conductor. The aperture statement undoes this box statement for the front and back faces. The conductor statement initializes the inner conductor. The esource statements initialize the source by setting the electric field between the inner and outer conductors to be a constant. The resistor statements set the termination resistor values. The required termination is 75 ohms. Since there are eight resistors, the value of each resistor is set to 600 ohms. The values along a line inside the transmission line are output to the file tline.out.
In this section, attempts to model a simple cavity are described. The cavity is shown in Figure 13. It is a rectangular cavity that is connected to a network analyzer by two cables. A wide trace goes between the two ports as shown in the figure. The width of the trace is 16 cm and it is 2 cm above the plane of the ports.
The trace is modeled as a two-dimensional conducting body. It is assumed here that the length and the width are so large compared to the thickness so that not modeling the thickness of the trace will not make a difference. The input at port one is modeled as an "isource". The load at the other port is modeled as two 25-ohm resistors in series. The transfer coefficient S21 for the simulated plot is calculated by taking the voltage across the load 50-ohm resistor and dividing it by the input voltage (the voltage across the "isource").
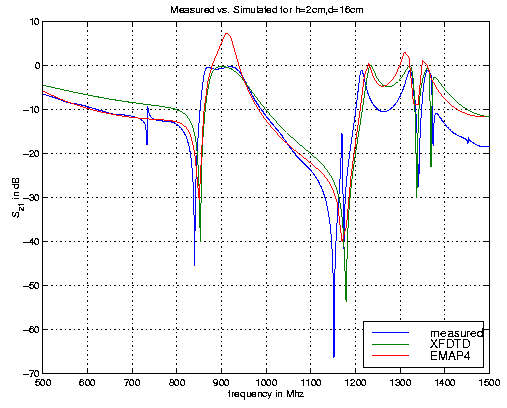
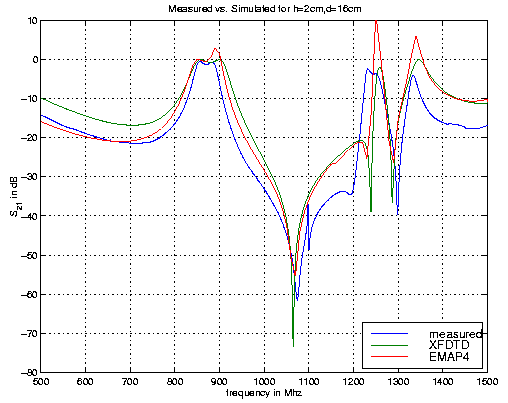
Figure 14 compares the EMAP4 results to the measured
transfer coefficient when the height of the trace is 2 cm above
the plane of the ports. Simulations using XFDTD are also
provided. Figure 15 compares EMAP4, XFDTD and measurements when
the trace is 4 cm above the plane of the ports. Although he
agreement is reasonable, there are a few shortcomings to this
model. The first is that the diameter of the wires connecting
the ports to the trace is not modeled. The second is that the
source and the loads are not modeled the perfectly (the model
here is correct if the whole setup were a circuit).

Figure 14: Comparison of measured and
simulated results for h=2cm.

Figure 15: Comparison of simulations and
measurements for h=4cm