Eating Detection Project
Problem
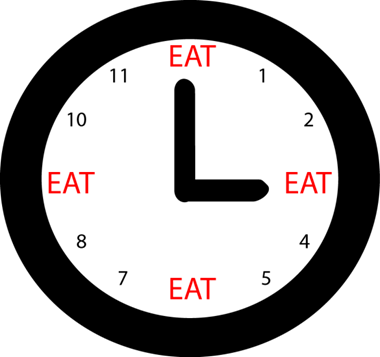
This project uses a wrist-worn device to track wrist motion all day
and detect periods of time in which the person wearing the device is eating.
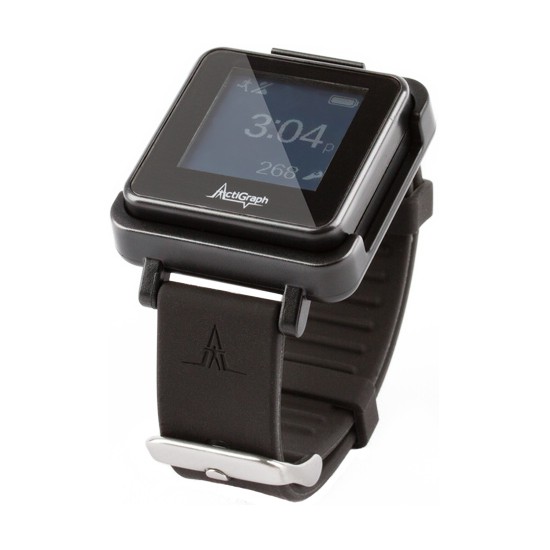
Our current work uses the
The Shimmer 3 device, but we have also processed data collected by the
Actigraph gt9x device, Apple iPhones, and others.
 |
 |
 |
| Detecting periods of time of eating |
Shimmer 3 |
ActiGraph gt9x |
Method
The below figure shows a plot of wrist motion energy (total amount of
linear acceleration) of a person for an entire day (7:30 AM to 7:30 PM).
The subject kept a record of periods of time of eating, which are indicated
by arrows along with the names of the meal (e.g. breakfast).
We discovered that eating periods tend to have lower values of wrist motion
energy surrounded by peaks of higher wrist motion energy.
The higher peaks are typically due to meal preparation and cleanup in which
the hands and wrists are moving a lot more than during actual consumption.
Our algorithm uses peaks to segment the data and then calculates additional
features between peaks to classify the periods of time.
Example output
The below figure shows an example of our classifier output.
The y-axis is wrist motion energy (total amount of
linear acceleration) and x-axis is time of day (10:30 AM to midnight).
The subject's self-reported times of eating for lunch and dinner are
indicated.
Arrows above wrist motion energy indicate the boundaries of time our
algorithm used to segment the data.
Classifier output (eating, other, rest or walking) is indicated below
the wrist motion energy.
Data
We have collected a very large data set (351 people, 1 day each)
of recordings like the one shown above.
See the
Clemson All-day
Dataset (CAD) webpage for information and download.
Software
Desktop software for Windows can be downloaded here.
The software analyzes wrist motion data to detect eating episodes
(meals, snacks) and count the number of bites taken in each episode.
It is free and source code is included.
It can process Actigraph files, Shimmer files, and files from smartwatches.
A single example data file is available
here, along with the subject's
self-reported eating for the day.
This data can be loaded into the above software (save both files
in the same folder) to demo how it works.
Papers about this project:
-
S. Sharma and A. Hoover,
"Top-Down Detection of Eating Episodes by Analyzing Large Windows
of Wrist Motion Using a Convolutional Neural Network",
in MDPI Bioengineering, vol 9, no 70, 2022
-
-
S. Sharma, P. Jasper, E. Muth and A. Hoover,
"The impact of walking and resting on wrist motion for automated detection
of meals",
in ACM Transactions on Computing for Healthcare, 1(4), pp. 1-19, 2020.
-
A. Sharma and A. Hoover,
"A Study on Linear Acceleration of the Wrist During Free-living",
in the proc. of IEEE
Intl Conf on Bioinformatics and Biomedicine, Nov. 2019.
-
A. Hoover, E. Muth, Y. Dong and J. Scisco,
"Device and Method for Detecting Eating Activities",
USA, Patent No. 9685097, filed July 2012, granted June 20, 2017.
-
S. Sharma, P. Jasper, E. Muth, and A. Hoover,
"Automatic Detection of Periods of Eating using Wrist Motion Tracking",
in the proc. of IEEE Conference on Connected Health: Applications,
Systems and Engineering Technologies, 2016, pp. 362-363.
-
Y. Dong, J. Scisco, M. Wilson, E. Muth and A. Hoover,
"Detecting Periods of Eating During Free-Living by Tracking Wrist Motion",
in IEEE Journal of Biomedical and Health Informatics,
vol. 18 no. 4, July 2014, pp. 1253-1260.
-
Y. Dong, A. Hoover, J. Scisco and E. Muth,
"Detecting Eating Using a Wrist Mounted Device During
Normal Daily Activities",
in the proc. of WorldComp, 2011.
Eating Detection Page / Clemson / ahoover@clemson.edu

