Urine Test for At-Home Monitoring of Blood Phenylalanine Levels for Individuals with Phenylketonuria (PKU)
Phenylketonuria (PKU) is a rare genetic disorder that occurs in approximately 1 in 10,000 births, which, if untreated, results in toxic levels of phenylalanine (Phe) in the blood stream leading to permanent mental disability within the first few months of birth. Treatment for PKU involves controlling blood Phe levels using a low-protein diet combined with specialized medical foods and close monitoring of blood Phe levels to achieve a targeted range of 120 – 360 M (2.0-6.0 mg/dL). Currently, there is no at-home test method to allow individuals with PKU to monitor their Phe levels on a daily basis, so blood samples must be periodically taken at home and mailed to clinical laboratories for evaluation. Laboratory tests typically take 5-10 days for results to be received, thus making it difficult to manage Phe levels by dietary adjustment on a daily basis. To address this problem, we are developing simple, low-cost urine test methods that are designed for at-home use by individuals with PKU or by clinical laboratories in third-world settings to provide the ability to perform low-cost blood-Phe-level monitoring on a daily basis.
Ongoing Clinical Trial for Evaluation of an At-Home Urine Test for Blood Phe Monitoring (PKU)
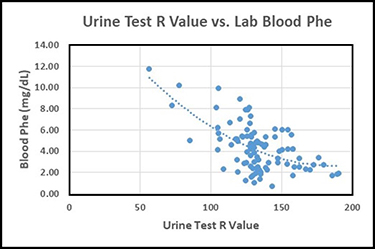
An IRB-approved clinical trial was initiated in June 2019 to evaluate the at-home urine test for estimating blood Phe levels that we have been developing over the past five years. This initial clinical trial was necessarily limited to being conducted with only about 10-12 volunteers with PKU. For the clinical trial, each volunteer has agreed to test their blood Phe level via their normal clinical facility at least once per month and to conduct the urine test at approximately the same time that the blood sample was taken. For the urine test, a special colorimetric test disc is dipped in a urine sample, photographed using a smartphone, and then the R value of the RGB color scale is read from the center of the test disc after just one minute to quantify the colorimetric response.  The photograph of the urine test disc and the Phe level from the blood test are then emailed to Dr. Latour (PI) for comparison. The graph below presents the data obtained thus far in the form of the R values from the urine tests vs. the corresponding blood Phe levels (mg/dL) excluding a few statistical outlier data points. A best-fit curve is shown in the data plot to provide a predicted blood Phe level for a given R value from the urine test. The results thus far show that the average difference between the blood Phe values estimated from the urine test results and the blood Phe levels reported by clinical laboratories is less than 1.4 mg/dL, with 90% of the estimated blood Phe levels being within 3.0 mg/dL of the laboratory-reported blood Phe values. It should be understood that much of the scatter in the data plot can be associated with person-to-person physiological differences as well as differences between smartphone cameras. Thus it is anticipated that the urine test will provide even better predictability of blood Phe levels on an individual basis.
